Shloka Shah
Software Engineer at HackerRank
Backend Development | Machine Learning | AWS | Software Development
Technical Blogger | Speaker | Volunteer at FOSS United | Winter Intern'21 at HackerRank | GHCI'20 Scholar | SIH'20 Finalist
B.Tech CSE, Sardar Patel Institute of Technology, 2021
Bangalore, India
Data Visualization for Library
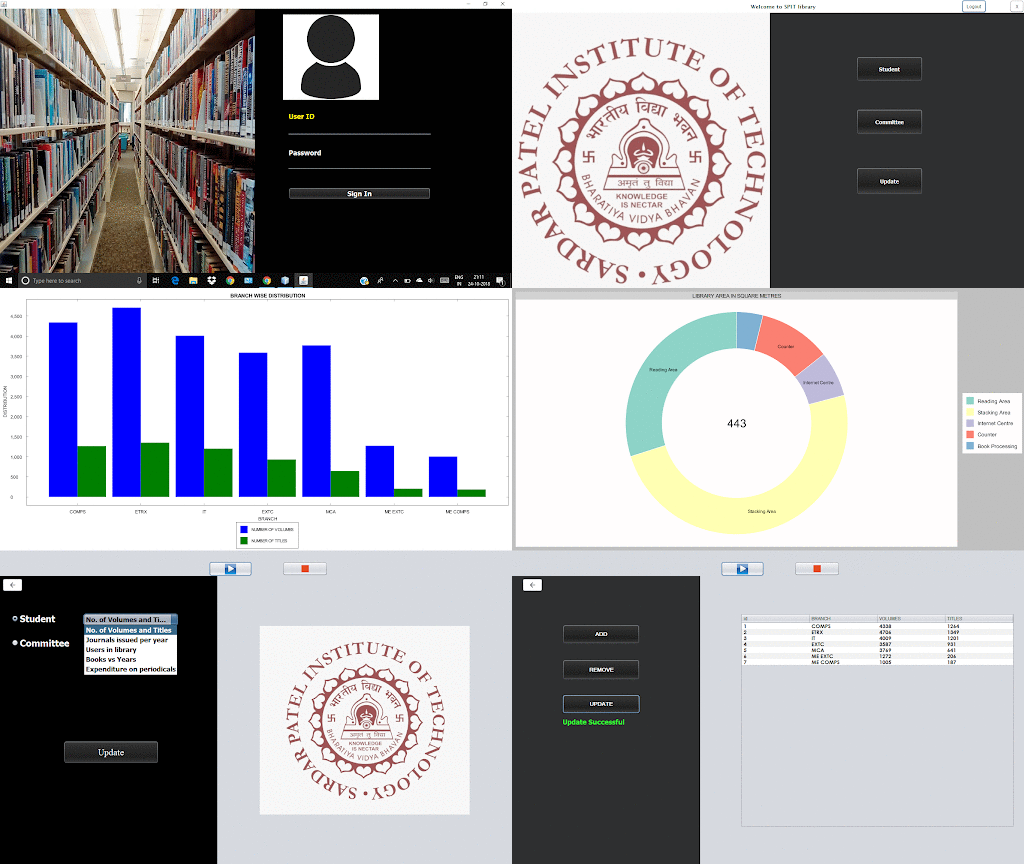
The desktop application provides the means to convey the data of the library to the members of the library (Students as well as teaching staff). It gives access to 2 slideshow options (Student & Committee), which can be selected as per the librarians requirement. Both slideshows show data visualizations rather than hard data which is cumbersome to understand.
Features
1. Slideshow of the data in a visual and easy to understand manner.
2. Users(Admin) can add/update/delete the library data according to the requirement based on which graphs are also updated.
Technology Stack
1. The user interface was designed using Java Swing
2. Database used was MySQL
3. Charts were made using XCharts
Application Demo
